Monitoring the quality of your model
While ISOLDE’s live annotations help you see at a glance where likely problems are in whatever part of the model you happen to be looking at, it is of course still important to have access to a quick overview summary of potential problems. This is handled on the Validate tab on the ISOLDE panel. If you click there, you’ll intially be greeted by this rather boring view:
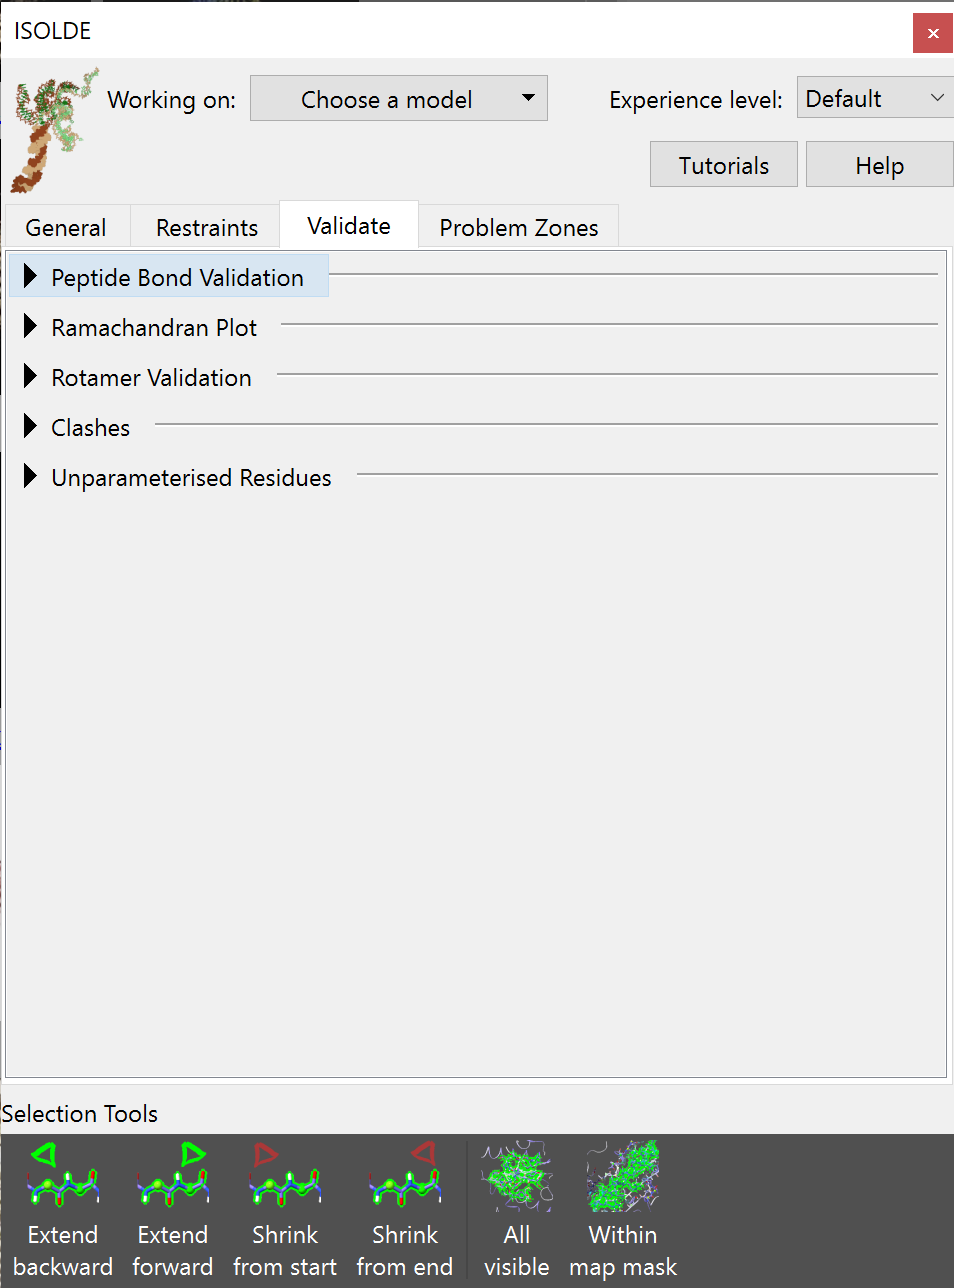
Expect the number of options to grow as ISOLDE develops further
Let’s go through and look at what each of these buttons does.
Peptide Bond Validation
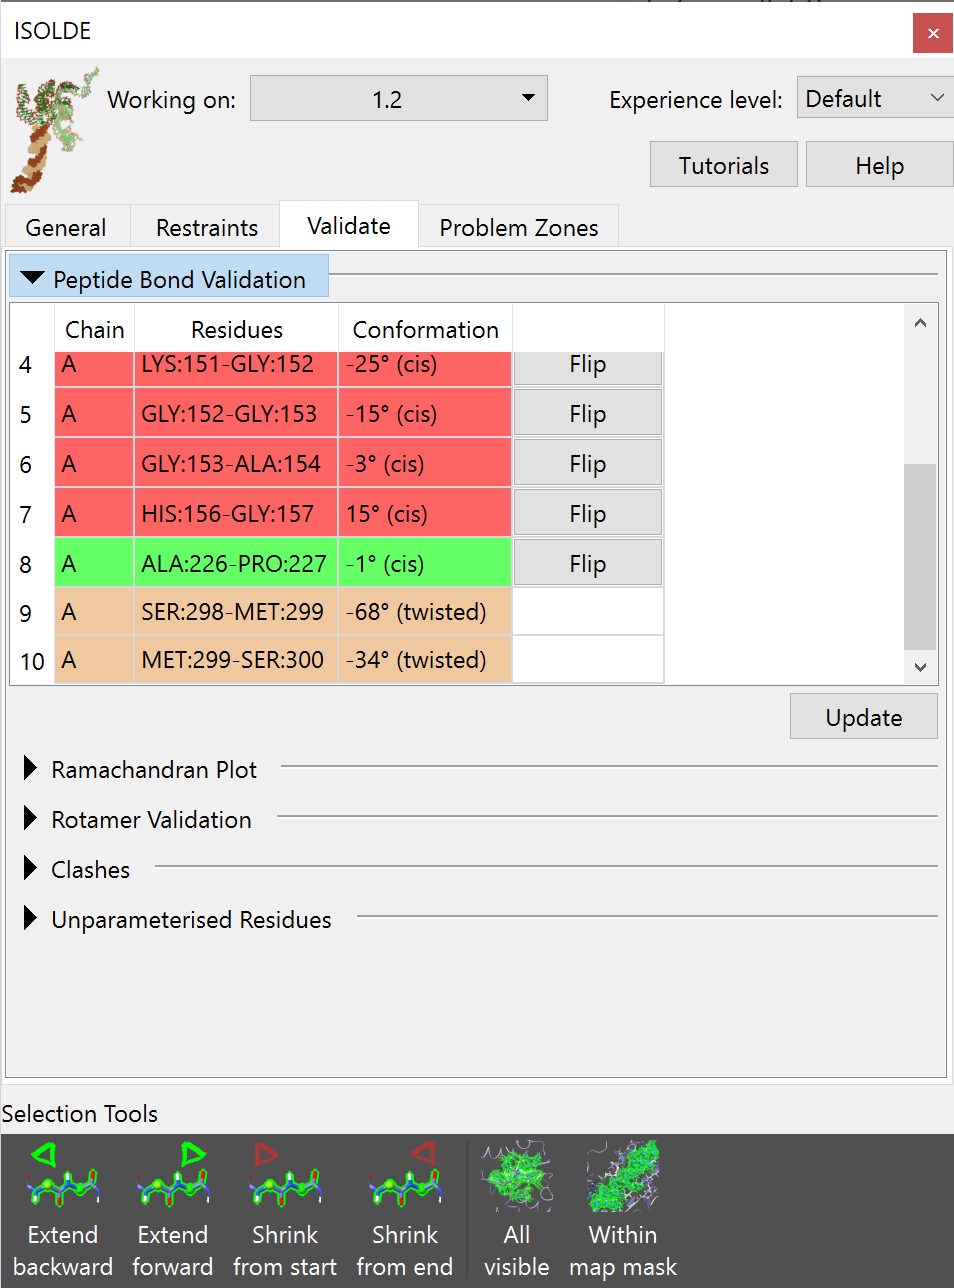
Tabulated list of questionable peptide bonds
Red: non-proline cis peptide bond Green: proline cis peptide bond Yellow: twisted peptide bond (more than 30° from planar)
Clicking on any entry in the list will select the residue in question and take you to it in the main view.
In a peptide bond, the valence electrons are partially delocalised (think of it as the carbon-nitrogen bond spending some fraction of its time as a double bond), giving it a strong bias towards planarity. While in some rare, tightly constrained conditions real peptide bonds have been observed to be twisted up to 30°, any twist beyond that is effectively unheard of.
The question of trans vs cis peptide bonds is less obvious. The vast majority of all peptide bonds are found in trans (with the amide hydrogen pointing in the opposite direction to the carbonyl oxygen):

This occurs due to steric considerations: swapping to cis replaces the amide hydrogen with the next alpha carbon, and carbon atoms are simply too big to pack neatly together in this way. Forcing them to do so puts strain on the intervening bonds, which requires energy. For this reason, for all residues other than proline cis peptide bonds are vanishingly rare at about 3 per 10,000 residues - and when they do occur are strongly stabilised by interactions with their surroundings, usually well-resolved, and almost always functionally interesting.
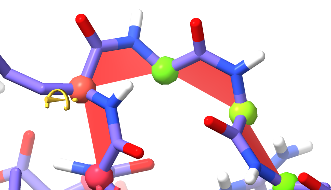
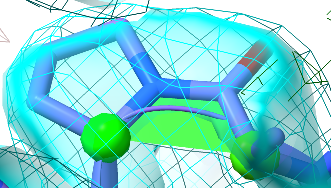
This should never happen.
A loop like this, with four non-proline cis peptide bonds in a row and no stabilising influences whatsoever, is for all intents and purposes impossible.
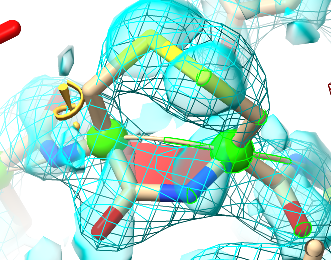
This, on the other hand, is real.
This non-proline cis bond is found in tissue transglutaminase (TGM2, see PDB ID 2q3z), and is stabilised by a disulphide bond between directly adjacent cysteine residues. It is part of a redox-switching mechanism: under certain circumstances the disulphide is reduced by thioredoxin, allowing the peptide bond to flip to trans and thereby shifting an inhibitory loop to activate the enzyme. It is also clearly resolved in the electron density.
If your site in question does not meet the above criteria, then in general you should assume it to be trans (unless, of course, you have outside evidence such as a higher-resolution structure of a closely-related protein).
Proline is a special case. Unlike the other amino acids, proline does not have an amide hydrogen - instead the amide nitrogen links to the backbone delta carbon. With both cis and trans conformers putting a carbon atom adjacent to the alpha carbon, the drive towards the trans conformation is nowhere near as strong, and about 5% of all proline residues appear in cis. With this in mind, cis prolines are coloured in green to reflect their higher likelihood (but keep in mind that they do still need to agree with the density map, as in the below case).
A happy-looking cis-proline.
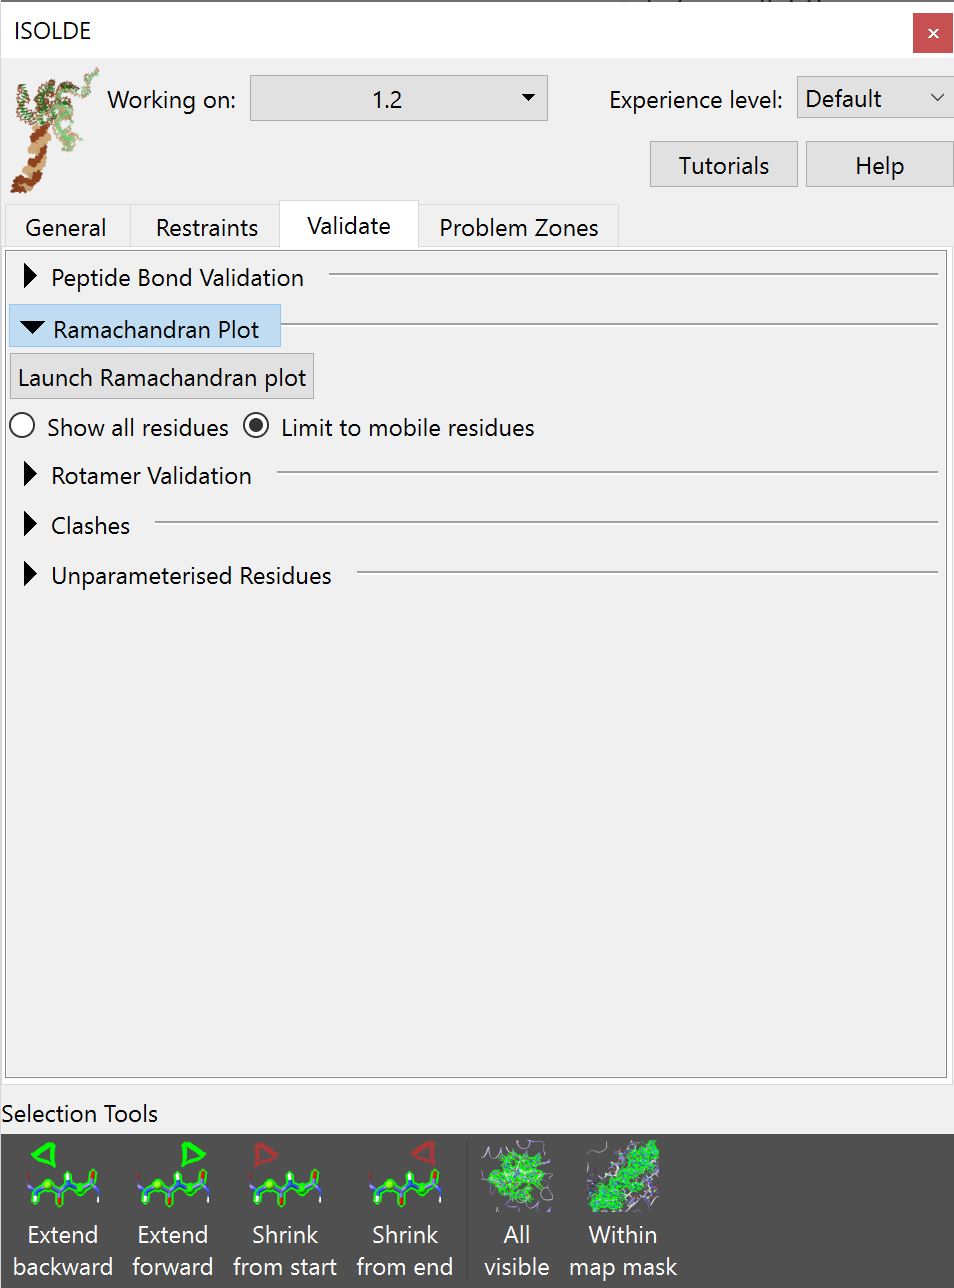
The Ramachandran plot
Expanding the Ramachandran Plot widget will expose a rather minimalist GUI - just a button to launch the Ramachandran Plot widget and some options to control how it behaves during simulations:
Clicking the “Launch Ramachandran Plot” button will launch the plot as a separate widget (this is also available without starting ISOLDE via the ChimeraX menu: Tools/Validation/Ramachandran Plot):
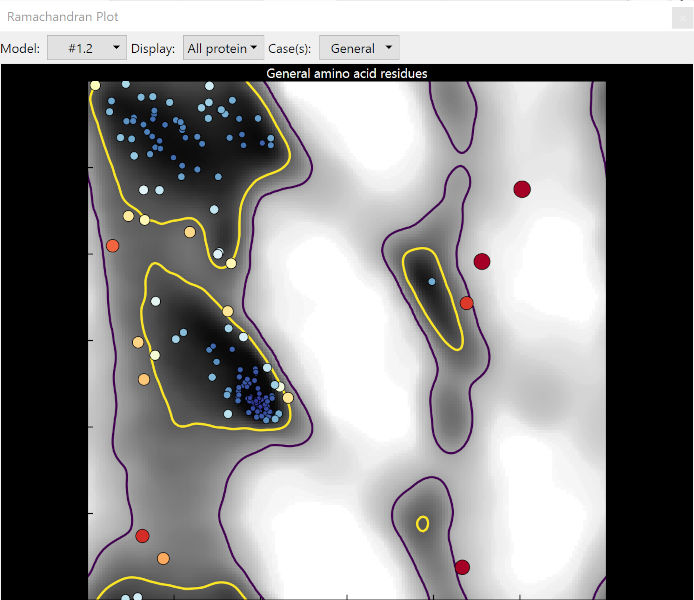
The Ramachandran plot for “general” amino acids
In brief, the Ramachandran plot plots the angle of the phi (φ) dihedral “entering” the residue against that of the psi (ψ) dihedral “exiting” it.
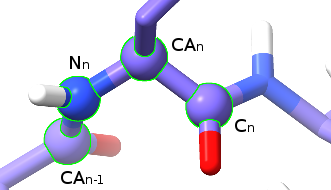
The four atoms making up the phi (φ) dihedral.
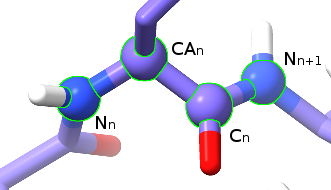
The four atoms making up the psi (ψ) dihedral.
Since atoms are physical objects that really don’t like to overlap with each other, only some combinations of φ and ψ are possible (and only a much smaller proportion of the range of possible combinations are favourable). That is what the Ramachandran plot is telling you.
The yellow contour line represents the 2% cut-off: 98% of all well-resolved residues in very high-resolution structures are found within these contours. Unsurprisingly, they mostly represent the well-defined secondary structures: the big yellow blob in the top left corresonds to α-helices, while the slightly smaller middle-left blob corresponds to β-strands. Residues within these contours are said to be in “favoured” conformations.
The purple line, meanwhile, represents the boundary of the far more generous “allowed” region. The precise value of this contour varies slightly depending on the Ramachandran category, but for the general case only about 5 in 10,000 residues should be found outside it, in what is known as “outlier” space.
Note that as well as the given cut-off contours, the background is also shaded according to probability. A residue outside the contour but still on a grey zone may still be correct (but should be very carefully checked), but one sitting on a white background is almost certainly wrong.
As you can see from the example image above, the size and colour of each point scales with its probability, making outliers very difficult to ignore. Hovering the mouse over any point in the plot will bring up a tooltip with its identity, and clicking the point will take you to the corresponding residue in the main window and select it.
The drop-down menus at the top of the Ramachandran Plot widget provide various options allowing you to limit the view to an individual chain or a custom selection, plot only disfavoured and/or outlier residues, and switch between individual residue classes (or show plots for all classes side-by-side).
While the Ramachandran widget is active, any changes to model coordinates will automatically update the plot. Note that this comes with some performance cost (particularly for very large models) - if that becomes problematic, you should close the plot widget during simulations.
Rotamer Validation
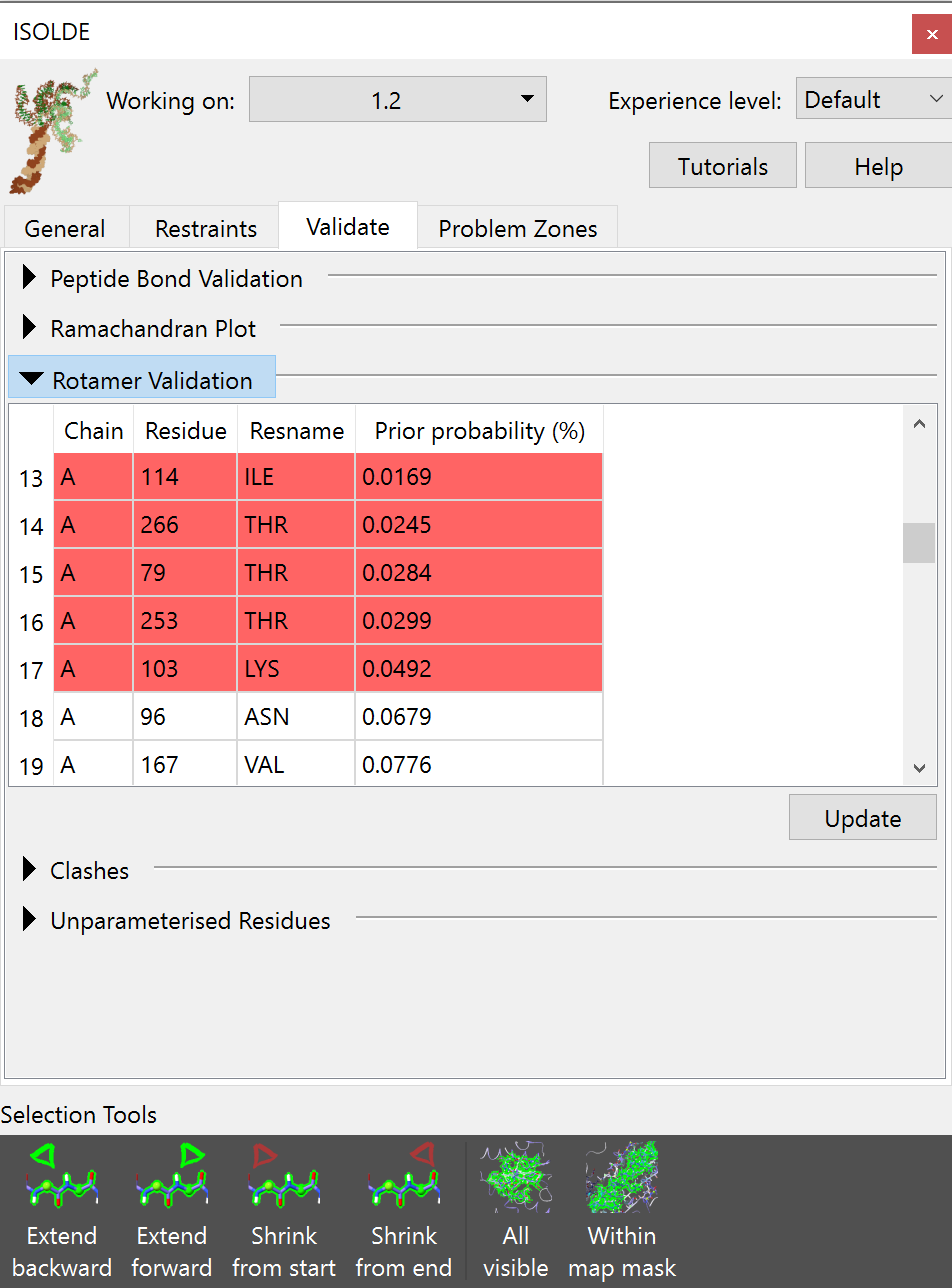
All non-favoured rotamers are listed in the table, ordered from worst to best. As for the other validation tools, clicking on an entry will select and take you to the offending residue.
Clashes
This table lists any pairwise atomic clashes (that is, non-bonded atoms that are closer together than the sum of their van der Waals radii should allow).
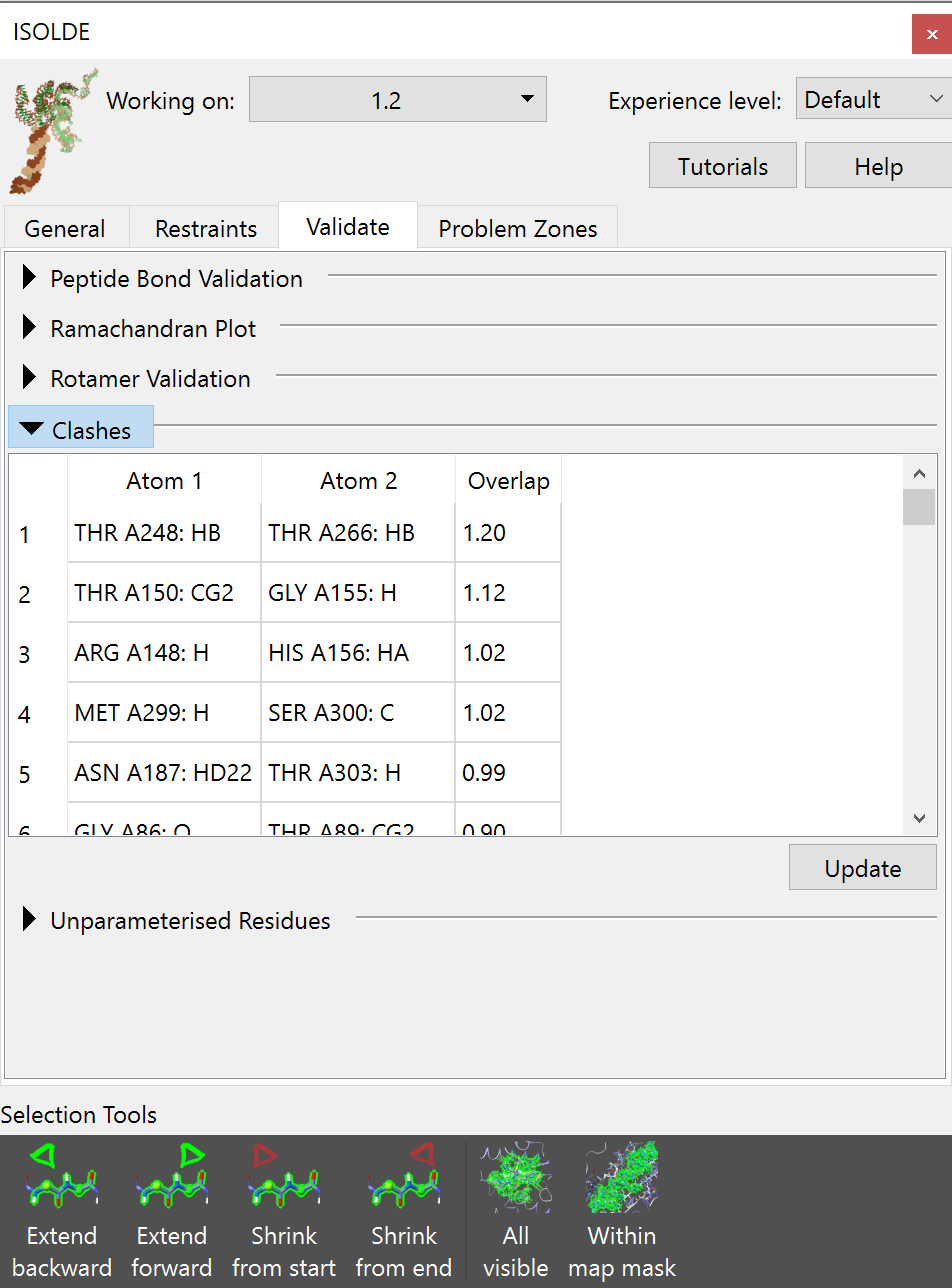
Clicking on an entry in the table will select and focus the view on the offending atom(s). Most minor clashes should be straightforwardly resolved by energy minimisation, and once your model is successfully running in simulations this table should be nearly empty. For particularly severe clashes where parts of the model are entangled with each other, some work will be needed before you can safely start simulations (see Dealing with severe clashes).
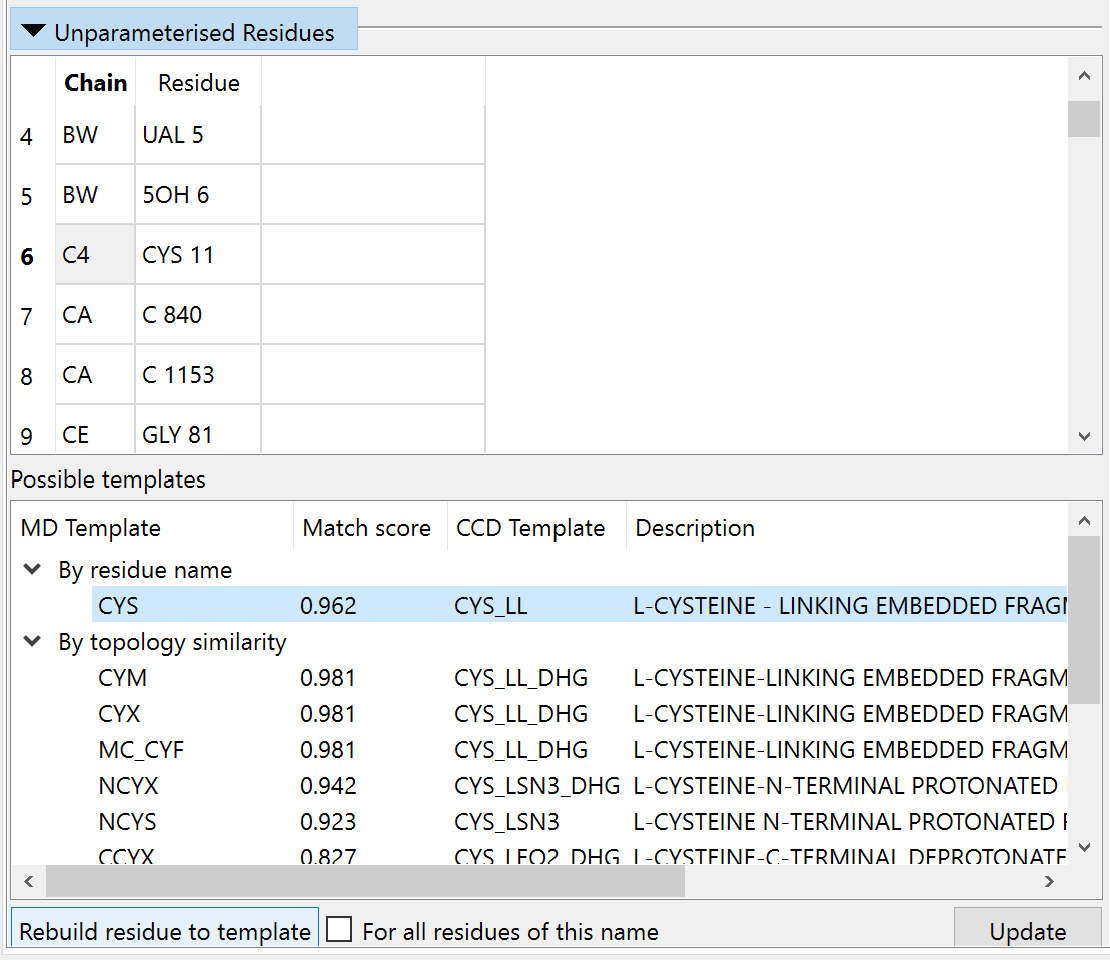
Unparameterised Residues